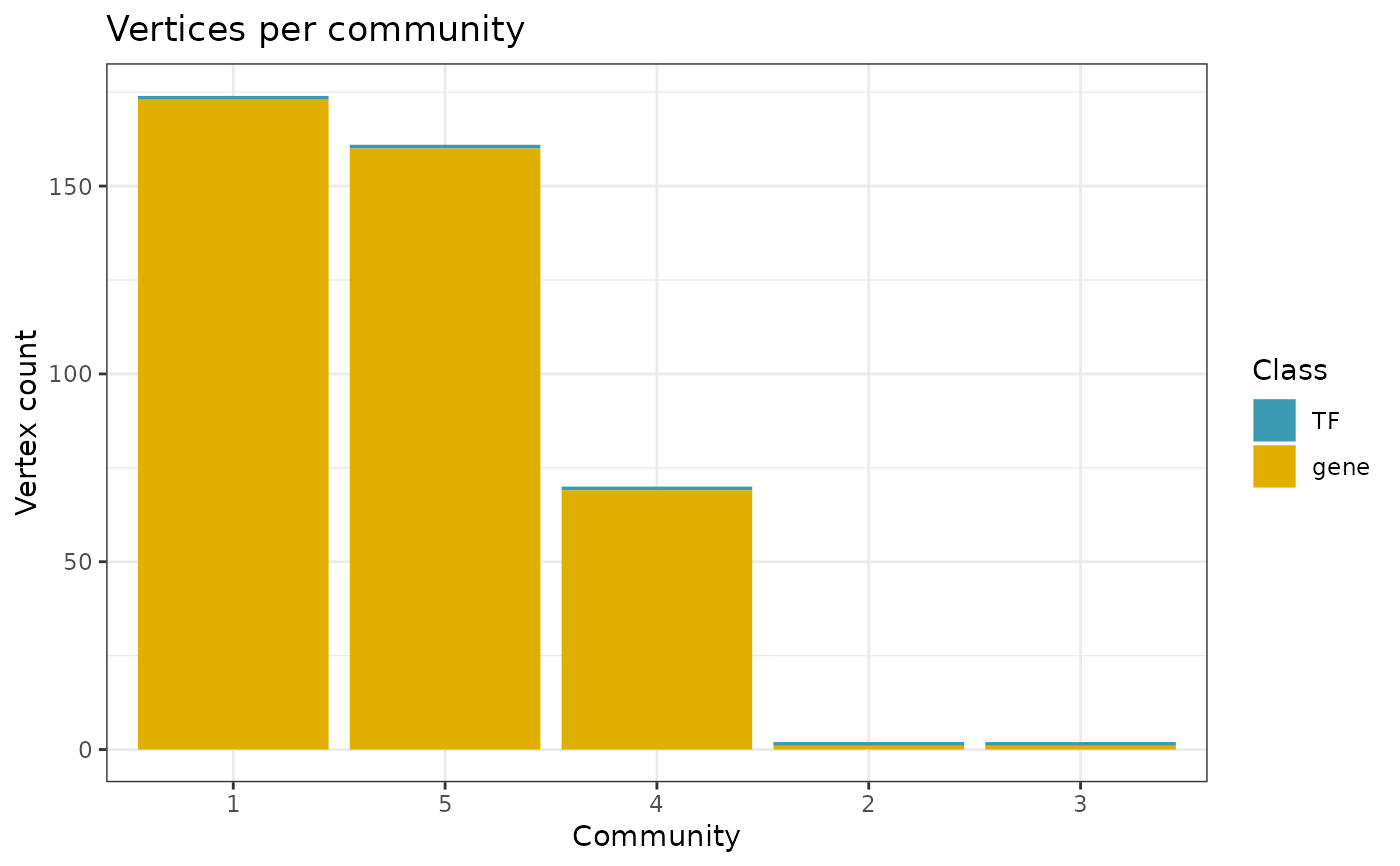
Plot general structure & connectivity statistics for each community in a filtered GRN
plotCommunitiesStats.RdSimilarly to the statistics produced by plotGeneralGraphStats, summaries regarding the vertex degrees and the most important vertices per community are generated. Note that the communities need to first be calculated using the calculateCommunitiesStats function
plotCommunitiesStats(
  GRN,
  outputFolder = NULL,
  basenameOutput = NULL,
  selection = "byRank",
  communities = seq_len(5),
  topnGenes = 20,
  topnTFs = 20,
  plotAsPDF = TRUE,
  pdf_width = 12,
  pdf_height = 12,
  pages = NULL,
  forceRerun = FALSE
)
Arguments
- GRN
Object of class
GRN- outputFolder
Character or
NULL. DefaultNULL. If set toNULL, the default output folder as specified when initiating the object ininitializeGRNwill be used. Otherwise, all output from this function will be put into the specified folder. If a folder is provided, while we recommend specifying an absolute path, a relative one also works.- basenameOutput
NULLor character. DefaultNULL. Basename of the output files that are produced. If set toNULL, a default basename is chosen. If a custom basename is specified, all output files will have the chosen basename as file prefix, be careful with not overwriting already existing files (ifforceRerunis set toTRUE)- selection
Character. Default
"byRank". One of:"byRank","byLabel". Specify whether the communities will be selected based on their rank or explicitly by their label. Note that the label is independent of the rank. When set to"byRank", the largest community (with most vertices) always has a rank of 1.- communities
NULLor numeric vector or character vector. DefaultNULL. If set toNULL, all community enrichments that have been calculated before are plotted. If a numeric vector is specified (whenselection = "byRank"), the rank of the communities is specified. For example,communities = c(1,4)then denotes the first and fourth largest community. If a character vector is specified (whenselection = "byLabel"), the name of the communities is specified instead. For example,communities = c("1","4")then denotes the communities with the names "1" and "4", which may or may not be the largest and fourth largest communities among all.- topnGenes
Integer > 0. Default 20. Number of genes to plot, sorted by their rank or label.
- topnTFs
Integer > 0. Default 20. Number of TFs to plot, sorted by their rank or label.
- plotAsPDF
TRUEorFALSE. DefaultTRUE.Should the plots be printed to a PDF file? If set toTRUE, a PDF file is generated, the name of which depends on the value ofbasenameOutput. If set toFALSE, all plots are printed to the currently active device. Note that most functions print more than one plot, which means you may only see the last plot depending on your active graphics device.- pdf_width
Number>0. Default 12. Width of the PDF, in cm.
- pdf_height
Number >0. Default 12. Height of the PDF, in cm.
- pages
Integer vector or
NULL. DefaultNULL. Page number(s) to plot. Can be used to plot only specific pages to a PDF or the currently active graphics device.- forceRerun
TRUEorFALSE. DefaultFALSE. Force execution, even if the GRN object already contains the result. Overwrites the old results.
Value
The same GRN object, without modifications.
Examples
# See the Workflow vignette on the GRaNIE website for examples
GRN = loadExampleObject()
#> Downloading GRaNIE example object from https://git.embl.de/grp-zaugg/GRaNIE/-/raw/master/data/GRN.rds
#> INFO [2023-08-16 17:29:16] Storing GRN@data$RNA$counts matrix as sparse matrix because fraction of 0s is > 0.1 (0.44)
#> Finished successfully. You may explore the example object. Start by typing the object name to the console to see a summaty. Happy GRaNIE'ing!
GRN = plotCommunitiesStats(GRN, plotAsPDF = FALSE, pages = 1)
#> INFO [2023-08-16 17:29:16] Plotting directly

#> INFO [2023-08-16 17:29:17]  Finished successfully. Execution time: 1 secs